This two part article is intended as an introduction to map projections and coordinate systems. The second part of the article will be published on Wednesday. They start a new series of articles which I shall be publishing over the next few weeks. I shall look at different projections and coordinate systems, the inadequacies of the current choices, and how to do something about it
Most users of online maps ignore the issues of different coordinate systems and projections. Any concern is usually limited to whether their system of choice will read the coordinates they have. As both are typically the same, the issue rarely surfaces. However, over the last two millenia, cartographers have produced hundreds if not thousands of different projections and coordinate systems for a wide range of different applications and locations.
Most online map services use geographic longitude,latitude coordinates on the WGS84 datum using a Mercator Projection. Although the coordinate system and datum are both logical choices for global mapping, As you shall see, Mercator is a poor choice of projection for most map applications.
So what are these different datums, coordinate systems, and projections? Why should we care?
There are three components to representing the Earth’s surface on a flat map:
- Datum: This represents the shape of the Earth
- Projection: This converts the curved shape of the Earth’s surface into a flat map.
- Coordinate System: This identifies points on the Earth’s surface (and map) using (typically) two numbers.
First, we shall look at different projections. The second half of the article will cover datums and some actual coordinate systems.
Projections
It is impossible to represent the Earth’s near-spherical surface on a flat map without stretching, tearing, or otherwise deforming it. A map projection represents the curved Earth’s surface on a flat plane. All projections result
in some distortion, so a choice has to be made to use the projection that is best for the application at hand. Over the centuries, many hundreds (if not thousands) of projections have been developed. A good history of these projections and their development can be found in John P. Snyder’s Flattening the Earth: Two Thousand Years of Map Projections.
A map has many metric properties. A projection can be chosen to preserve one or more of these properties, but not all of them. Some of these properties are:
- Area
- Shape
- Direction and Bearings
- Distances
- Scale
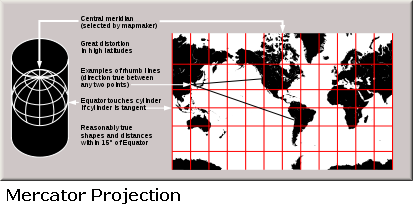
It is also possible to design a projection that has special properties. For example, great circles appear as straight lines on a Gnomonic projection ; and rhumb lines appear as straight lines on a Mercator projection.
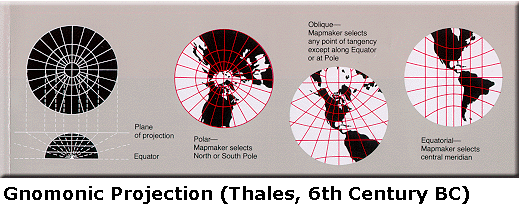
Clearly, a map intended for navigation should preserve direction and bearing. Straight rhumb lines (a line of constant bearing that connects two points) were also convenient in the age of sail and simple (if slow) navigation.
On the other hand, a map intended for statistical use should preserve area. The Mercator (BOLD) projection is often used to display statistical data, but it is a very poor choice for this kind of application. Areas are reduced near the equator and expanded near the pole. It is impossible to get a visual impression of size or data density. An equal area projection such as the Albers Conic projection should be chosen instead.
The remainder of this section covers some of the main projection types. Many projections work by projecting from the Earth to a intermediate shape (typically a cylinder or cone) that can be “unwrapped” into a flat plane. The initial projection results in some distortion, but the final ‘unwrapping’ should be free of distortion. Other projections are more mathematical and cannot be easily visualized in a geometric sense.
Cylindrical Projections
Cylindrical projections project the globe onto a cylinder which is then ‘unwrapped’ to form a plane.
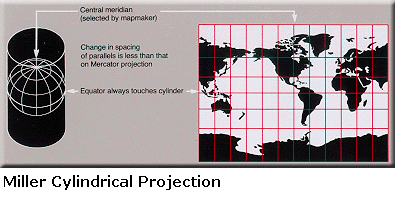
Two common examples of cylindrical projections are the Miller and Mercator projections. Both distort the polar regions. The Mercator projection attempts to reduce shape distortion by scaling the latitude to match the longitudinal distortion. This results in very large area distortions for the polar regions. The Miller projection has some area distortion but balances this with some shape distortion.
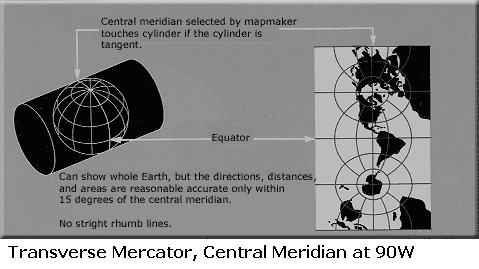
Although the cylinder is usually aligned with the equator in an east-west direction, this does not have to be the case. A Transverse Mercator projection rotates the cylinder 90 degrees. This is useful if you you are interested in minimum distortion along a particular line of longitude. This projection is an integral part of the Universal Transverse Mercator (UTM) projection and coordinate system, which we will discuss later.
Conic Projections
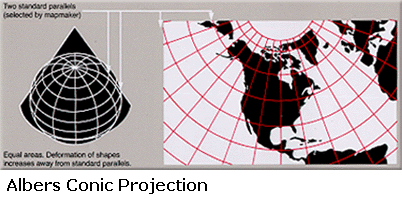
As the name suggests, conic projections project the globe onto a cone. An example of this kind of projection is the Albers projection, which is used by the US Census Bureau, as well as some US and Canadian States. The Albers (BOLD) projection is also an equal area projection. Relative areas are not distorted, making it useful for statistical applications. The Albers projection is defined by two standard parallels. Shape and scale distortions are minimized between these parallels, although they do not disappear completely.
Planar Projections
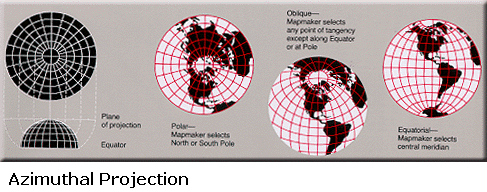
Planar projections project to a flat plane. These include azimuthal projections which have the property that all directions from a central point are preserved. They typically have very little distortion at the centre, but increasing distortion towards the edges. Perspective projections (ie. those that give a view obtainable from Earth orbit or a distant object such as the Moon) are a subset of azimuthal planar projections.
Pseudo-Cylindrical Projections
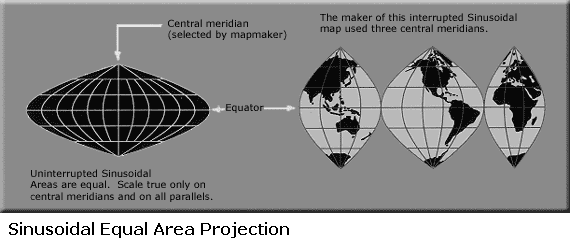
As the name suggests, pseudo-cylindrical projections resemble cylindrical projections but do not use a true cylinder. Each parallel and the central meridian are represented by single straight lines. All other meridians are curved. Example pseudo-cylindrical projections include the Sinusoidal, Mollweide, Eckert IV, and Eckert VI projections.
The Sinusoidal projection preserves area, but the scale is only true along the parallels and central meridian. Sometimes it is “interrupted” into segments with different central meridians. This results in less distortion, although the interruptions can be inconvenient for many applications.
Compromise Projections
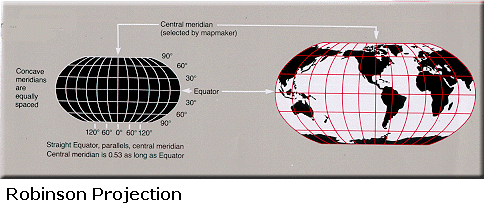
Compromise projections are a wide class of projections which are not usually designed to preserve a particular metric. Instead, they attempt to strike a balance between the distortion of different metrics, or they attempt to produce a map that looks right (eg. without the giant Greenland of the Mercator projection). Examples compromise projections include the Robinson, and Winkel Tripel projections.
Conclusions
This completes my initial survey of projections. In the second part of this article, I shall look at datums and coordinate systems. Also, next week I shall be looking at equal area projections in much more detail.
References and Acknowledgments
All of the above projection images are available from the Wikimedia Commons.